
Intelligence quotient (I.Q)
The average score, according to the bell curve, is 100. Individual subtest scores tend to correlate with one another, even when seemingly disparate in content.
What is the IQ ?
An intelligence quotient or IQ is a score derived from a set of standardized tests of intelligence. Intelligence tests come in many forms, and some tests use a single type of item or question. Most tests yield both an overall score and individual subtest scores. Regardless of design, all IQ tests attempt to measure the same general intelligence. Component tests are generally designed and selected because they are found to be predictive of later intellectual development, such as educational achievement. IQ also correlates with job performance, socioeconomic advancement, and "social pathologies". Recent work has demonstrated links between IQ and health, longevity, and functional literacy. However, IQ tests do not measure all meanings of "intelligence", such as wisdom. IQ scores are relative (like placement in a race), not absolute (like the measurement of a ruler).
For people living in the prevailing conditions of the developed world, IQ is highly heritable, and by adulthood the influence of family environment on IQ is undetectable. That is, significant variation in IQ between adults can be attributed to genetic variation, with the remaining variation attributable to environmental sources that are not shared within families. In the United States, marked variation in IQ occurs within families, with siblings differing on average by almost one standard deviation.
The average IQ scores for many populations were rising during the 20th century: a phenomenon called the Flynn effect. It is not known whether these changes in scores reflect real changes in intellectual abilities. On average, IQ scores are stable over a person's lifetime, but some individuals undergo large changes. For example, scores can be affected by the presence of learning disabilities.
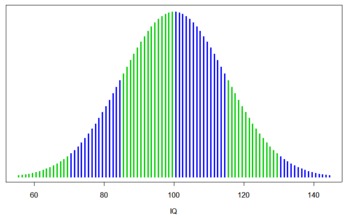
IQ tests are designed to give approximately this Gaussian distribution. Colors delineate one standard deviation.
1- The definition of the IQ
Originally, IQ was calculated with the formula 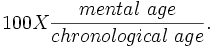
A 10-year-old who scored as high as the average 13-year-old, for example, would have an IQ of 130 (100*13/10).
Because this formula only worked for children, it was replaced by a projection of the measured rank on the Gaussian bell curve with a center value (average IQ) of 100, and a standard deviation of 15 or occasionally 16.
2- History of the IQ
In 1905, the French psychologist Alfred Binet published the first modern intelligence test, the Binet-Simon intelligence scale. His principal goal was to identify students who needed special help in coping with the school curriculum. Along with his collaborator Theodore Simon, Binet published revisions of his intelligence scale in 1908 and 1911, the last appearing just before his untimely death. In 1912, the abbreviation of "intelligence quotient" or I.Q., a translation of the German Intelligenz-Quotient, was coined by the German psychologist William Stern.
A further refinement of the Binet-Simon scale was published in 1916 by Lewis M. Terman, from Stanford University, who incorporated Stern's proposal that an individual's intelligence level be measured as an intelligence quotient (I.Q.). Terman's test, which he named the Stanford-Binet Intelligence Scale formed the basis for one of the modern intelligence tests still commonly used today. They are all colloquially known as IQ tests
3- IQ and general intelligence factor
Modern IQ tests produce scores for different areas (e.g., language fluency, three-dimensional thinking, etc.), with the summary score calculated from subtest scores. The average score, according to the bell curve, is 100. Individual subtest scores tend to correlate with one another, even when seemingly disparate in content.
Analysis of individuals' scores on the subtests of a single IQ test or the scores from a variety of different IQ tests (e.g., Stanford-Binet, WISC-R, Raven's Progressive Matrices, Cattell Culture Fair III, Universal Nonverbal Intelligence Test, and others) reveal that they all measure a single common factor and various factors that are specific to each test. This kind of factor analysis has led to the theory that underlying these disparate cognitive tasks is a single factor, termed the general intelligence factor (or g), that corresponds with the common-sense concept of intelligence. In the normal population, g and IQ are roughly 90% correlated and are often used interchangeably.
Various IQ tests measure a standard deviation with different number of points. Thus, when an IQ score is stated, the standard deviation used should also be stated. A result of 124 in a test with a 24-point standard deviation corresponds to a score of 115 in a test with a 15-point deviation.
Where an individual has scores that do not correlate with each other, there is a good reason to look for a learning disability or other cause for the lack of correlation. Tests have been chosen for inclusion because they display the ability to use this method to predict later difficulties in learning.
4- Genetics versus environment
The role of genes and environment (nature vs. nurture) in determining IQ is reviewed in Plomin et al. (2001, 2003). The degree to which genetic variation contributes to observed variation in a trait is measured by a statistic called heritability. Heritability scores range from 0 to 1, and can be interpreted as the percentage of variation (e.g. in IQ) that is due to variation in genes. Twins studies and adoption studies are commonly used to determine the heritability of a trait. Until recently heritability was mostly studied in children. Some studies find the heritability of IQ around 0.5 but the studies show ranges from 0.4 to 0.8;that is, depending on the study, a little less than half to substantially more than half of the variation in IQ among the children studied was due to variation in their genes. The remainder was thus due to environmental variation and measurement error. A heritability in the range of 0.4 to 0.8 implies that IQ is "substantially" heritable. Studies with adults show that they have a higher heritability of IQ than children do and that heritability could be as high as 0.8. The American Psychological Association's 1995 task force on "Intelligence: Knowns and Unknowns" concluded that within the white population the heritability of IQ is "around .75" (p. 85). The Minnesota Study of Twins Reared Apart, a multiyear study of 100 sets of reared apart twins which was started in 1979, concluded that about 70% of the variance in IQ was found to be associated with genetic variation.
The heritability of IQ has been tested on large numbers of twins, siblings, parent-child relationships, and adoptees. Evidence from family studies provides the main supporting evidence from which arguments about the relative roles of genetics and environment are constructed. Put all these studies together, which include the IQ tests of tens of thousands of individuals, and the table looks like this:
| Relationship | Correlation |
|---|---|
| The same person tested twice | 87% |
| Identical twins reared together | 86% |
| Identical twins reared apart | 76% |
| Fraternal twins reared together | 55% |
| Biological siblings | 47% |
| Parents and children living together | 40% |
| Parents and children living apart | 31% |
| Adopted children living together | 0% |
| Unrelated people living apart | 0% |
4.1- Environment
Environmental factors play a major role in determining IQ in extreme situations. Proper childhood nutrition appears critical for cognitive development; malnutrition can lower IQ. Other research indicates environmental factors such as prenatal exposure to toxins, duration of breastfeeding, and micronutrient deficiency can affect IQ. In the developed world, there are some family effects on the IQ of children, accounting for up to a quarter of the variance. However, by adulthood, this correlation disappears, so that the IQ of adults living in the prevailing conditions of the developed world may be more heritable.
Nearly all personality traits show that, contrary to expectations, environmental effects actually cause adoptive siblings raised in the same family to be as different as children raised in different families (Harris, 1998; Plomin & Daniels, 1987). Put another way, shared environmental variation for personality is zero, and all environmental effects would be nonshared. Conversely, IQ is actually an exception to this, at least among children. The IQs of adoptive siblings, who share no genetic relation but do share a common family environment, are correlated at .32. Despite attempts to isolate them, the factors that cause adoptive siblings to be similar have not been identified. However, as explained below, shared family effects on IQ disappear after adolescence.
Active genotype-environment correlation, also called the "nature of nurture", is observed for IQ. This phenomenon is measured similarly to heritability; but instead of measuring variation in IQ due to genes, variation in environment due to genes is determined. One study found that 40% of variation in measures of home environment are accounted for by genetic variation. This suggests that the way human beings craft their environment is due in part to genetic influences.
A study of French children adopted between the ages of 4 and 6 shows the continuing interplay of nature and nurture. The children came from poor backgrounds with I.Q.’s that initially averaged 77, putting them near retardation. Nine years later after adoption, they retook the I.Q. tests, and all of them did better. The amount they improved was directly related to the adopting family’s status. "Children adopted by farmers and laborers had average I.Q. scores of 85.5; those placed with middle-class families had average scores of 92. The average I.Q. scores of youngsters placed in well-to-do homes climbed more than 20 points, to 98." This study suggests that IQ is not stable over the course of ones lifetime and that, even in later childhood, a change in environment can have a significant effect on IQ.
It is well known that it is possible to increase ones IQ score by training, for example by regulary playing puzzle games. Recent studies have shown that training ones working memory may increase IQ. (Klingberg et al., 2002)
4.2- Development
It is reasonable to expect that genetic influences on traits like IQ should become less important as one gains experiences with age. Surprisingly, the opposite occurs. Heritability measures in infancy are as low as 20%, around 40% in middle childhood, and as high as 80% in adulthood.
Shared family effects also seem to disappear by adulthood. Adoption studies show that, after adolescence, adopted siblings are no more similar in IQ than strangers (IQ correlation near zero), while full siblings show an IQ correlation of 0.6. Twin studies reinforce this pattern: monozygotic (identical) twins raised separately are highly similar in IQ (0.86), more so than dizygotic (fraternal) twins raised together (0.6) and much more than adopted siblings (~0.0).
Most of the IQ studies described above were conducted in developed countries, such as the United States, Japan, and Western Europe. Also, a few studies have been conducted in Moscow, East Germany, and India, and those studies have produced similar results. Any such investigation is limited to describing the genetic and environmental variation found within the populations studied. This is a caveat of any heritability study. Another caveat is that people with chromosomal abnormalities - such as klinefelter's syndrome and Triple X syndrome, will score considerably higher than the normal population without the chromosomal abnormalities, when scored against visual IQ tests, not IQ tests that have been tailored to measure IQ against the normal population.
4.3- Mental retardation
About 75–80 percent of mental retardation is familial (runs in the family), and 20–25 percent is due to biological problems, such as chromosomal abnormalities or brain damage. Mild to severe mental retardation is a symptom of several hundred single-gene disorders and many chromosomal abnormalities, including small deletions. Based on twin studies, moderate to severe mental retardation does not appear to be familial, but mild mental retardation does. That is, the relatives of the moderate to severely mentally retarded have normal ranges of IQs, whereas the families of the mildly mentally retarded have lower IQs.
IQ score ranges (from DSM-IV):
- mild mental retardation: IQ 50–55 to 70; children require mild support; formally called "Educable Mentally Retarded".
- moderate retardation: IQ 35–40 to 50–55; children require moderate supervision and assistance; formally called "Trainable Mentally Retarded".
- severe mental retardation: IQ 20–25 to 35–40; can be taught basic life skills and simple tasks with supervision.
- profound mental retardation: IQ below 20–25; usually caused by a neurological condition; require constant care.
The rate of mental retardation is higher among males than females, according to a 1991 U.S. Centers for Disease Control and Prevention (CDC) study. This is aggravated by the fact that males, unlike females, do not have a spare X chromosome to offset chromosomal defects.
Individuals with IQs below 70 have been essentially exempted from the death penalty in the U.S. since 2002.
4.4- IQ, education, and income
Tambs et al. (1989) found that occupational status, educational attainment, and IQ are individually heritable; and further found that "genetic variance influencing educational attainment … contributed approximately one-fourth of the genetic variance for occupational status and nearly half the genetic variance for IQ". In a sample of U.S. siblings, Rowe et al. (1997) report that the inequality in education and income was predominantly due to genes, with shared environmental factors playing a subordinate role.
4.5- Regression
The heritability of IQ measures the extent to which the IQ of children appears to be influenced by the IQ of parents. Because the heritability of IQ is less than 100%, the IQ of children tends to "regress" towards the mean IQ of the population. That is, high IQ parents tend to have children who are less bright than their parents, whereas low IQ parents tend to have children who are brighter than their parents. The effect can be quantified by the equation 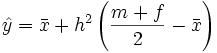 where
where
 is the predicted average IQ of the children;
 is the mean IQ of the population to which the parents belong;
- h2 is the heritability of IQ;
- m and f are the IQs of the mother and father, respectively.
Thus, if the heritability of IQ is 50%, a couple averaging an IQ of 120 may have children that average around an IQ of 110, assuming that both parents come from a population with a median IQ of 100.
A caveat to this reasoning are those children who have chromosomal abnormalities, such as Klinefelter's syndrome and Triple X syndrome whose "normal" IQ is only one indicator; their visual IQ is another indicator. And so forth.
5- IQ and the brain
5.1- Brain size and IQ
Modern studies using MRI imaging have shown that brain size correlates with IQ (r = 0.35) among adults (McDaniel, 2005). The correlation between brain size and IQ seems to hold for comparisons between and within families (Gignac et al. 2003; Jensen 1994; Jensen & Johnson 1994). However, one study found no familial correlation (Schoenemann et al. 2000). A study on twins (Thompson et al., 2001) showed that frontal gray matter volume was correlated with g and highly heritable. A related study has reported that the correlation between brain size (reported to have a heritability of 0.85) and g is 0.4, and that correlation is mediated entirely by genetic factors (Posthuma et al 2002).
In a study of the head growth of 633 term-born children from the Avon Longitudinal Study of Parents and Children cohort, it was shown that prenatal growth and growth during infancy were associated with subsequent IQ. The study’s conclusion was that the brain volume a child achieves by the age of 1 year helps determine later intelligence. Growth in brain volume after infancy may not compensate for poorer earlier growth.
5.2- Brain areas associated with IQ
Many different sources of information have converged on the view that the frontal lobes are critical for fluid intelligence. Patients with damage to the frontal lobe are impaired on fluid intelligence tests (Duncan et al 1995). The volume of frontal grey (Thompson et al 2001) and white matter (Schoenemann et al 2005) have also been associated with general intelligence. In addition, recent neuroimaging studies have limited this association to the lateral prefrontal cortex. Duncan and colleagues (2000) showed using Positron Emission Tomography that problem-solving tasks that correlated more highly with IQ also activate the lateral prefrontal cortex. More recently, Gray and colleagues (2003) used functional magnetic resonance imaging (fMRI) to show that those individuals that were more adept at resisting distraction on a demanding working memory task had both a higher IQ and increased prefrontal activity. For an extensive review of this topic, see Gray and Thompson (2004).
In 2004, Richard Haier, professor of psychology in the Department of Pediatrics and colleagues at University of California, Irvine and the University of New Mexico used MRI to obtain structural images of the brain in 47 normal adults who also took standard IQ tests. The study demonstrated that general human intelligence appears to be based on the volume and location of gray matter tissue in the brain. Regional distribution of gray matter in humans is highly heritable. The study also demonstrated that, of the brain's gray matter, only about 6 percent appeared to be related to IQ.
5.3- Brain structure and IQ
A study involving 307 children (age between six to nineteen) measuring the size of brain structures using magnetic resonance imaging (MRI) and measuring verbal and non-verbal abilities has been conducted (Shaw et al 2006). The study has indicated that there is a relationship between IQ and the structure of the cortex—the characteristic change being the group with the superior IQ scores starts with thinner cortex in the early age then becomes thicker than average by the late teens.
6- The Flynn effect
The Flynn effect is named after James R. Flynn, a New Zealand based political scientist. He discovered that IQ scores worldwide appear to be slowly rising at a rate of around three IQ points per decade (Flynn, 1999). Attempted explanations have included improved nutrition, a trend towards smaller families, better education, greater environmental complexity, and heterosis (Mingroni, 2004). However, tests are renormalized occasionally to obtain mean scores of 100, for example WISC-R (1974), WISC-III (1991) and WISC-IV (2003). Hence it is difficult to compare IQ scores measured years apart.
There is recent evidence that the tendency for intelligence scores to rise has ended in some first world countries. In 2004, Jon Martin Sundet of the University of Oslo and colleagues published an article documenting scores on intelligence tests given to Norwegian conscripts between the 1950s and 2002, showing that the increase in scores of general intelligence stopped after the mid-1990s and in numerical reasoning subtests, declined.
Thomas W. Teasdale of the University of Copenhagen and David R. Owen of Brooklyn College, City University of New York, discovered similar results in Denmark, where intelligence test results showed no rise across the 1990s.
Indications that scores on intelligence tests are not universally climbing have also come from the United Kingdom. Michael Shayer, a psychologist at King's College, University of London, and two colleagues report that performance on tests of physical reasoning given to children entering British secondary schools declined markedly between 1976 and 2003.
7- Group difference
Among the most controversial issues related to the study of intelligence is the observation that intelligence measures such as IQ scores vary between populations. While there is little scholarly debate about the existence of some of these differences, the reasons remain highly controversial both within academia and in the public sphere.
7.1- Sex and intelligence
Most studies show that despite sometimes significant differences in subtest scores, men and women have the same average IQ. Women perform better on tests of memory and verbal proficiency for example, while men perform better on tests of mathematical and spatial ability. Although gender-related differences in average IQ are insignificant, male scores display a higher variance: there are more men than women with both very high and very low IQs (for more details, see main article Sex and intelligence).
7.2- Race and IQ
While IQ scores of individual members of different racial or ethnic groups are distributed across the IQ scale, groups may vary in where their members cluster along the IQ scale. East Asians cluster higher than Europeans, while Hispanics and Sub-Saharan Africans cluster lower in the USA. Much research has been devoted to the extent and potential causes of racial-ethnic group differences in IQ, and the underlying purposes and validity of the tests has been examined. Most experts conclude that examination of many types of test bias and simple differences in socioeconomic status have failed to explain the IQ clustering differences. For a summary of expert opinions, see Race and Intelligence.
The findings in this field are often thought to conflict with fundamental social philosophies, and have resulted in controversy.
7.3- Health and IQ
Persons with a higher IQ have generally lower adult morbidity and mortality. This may be because they better avoid injury and take better care of their own health, or alternatively may be due to a slight increased propensity for material wealth (see above). Post-Traumatic Stress Disorder, severe depression, and schizophrenia are less prevalent in higher IQ bands. The Archive of General Psychiatry published a longitudinal study of a randomly selected sample of 713 study participants (336 boys and 377 girls), from both urban and suburban settings. Of that group, nearly 76 percent had suffered through at least one traumatic event. Those participants were assessed at age 6 years and followed up to age 17 years. In that group of children, those with an IQ above 115 were significantly less likely to have Post-Traumatic Stress Disorder as a result of the trauma, less likely to display behavioral problems, and less likely to experience a trauma. The low incidence of Post-Traumatic Stress Disorder among children with higher IQs was true even if the child grew up in an urban environment (where trauma averaged three times the rate of the suburb), or had behavioral problems. On the other hand, higher IQ shows a higher prevalence of those conditioned with Obsessive Compulsive Disorder.
Research in Scotland has shown that a 15-point lower IQ meant people had a fifth less chance of seeing their 76th birthday, while those with a 30-point disadvantage were 37% less likely than those with a higher IQ to live that long.
A decrease in IQ has also been shown as an early predictor of late-onset Alzheimer's Disease and other forms of dementia. In a 2004 study, Cervilla and colleagues showed that tests of cognitive ability provide useful predictive information up to a decade before the onset of dementia.
However, when diagnosing individuals with a higher level of cognitive ability, in this study those with IQ's of 120 or more, patients should not be diagnosed from the standard norm but from an adjusted high-IQ norm that measured changes against the individual's higher ability level.
In 2000, Whalley and colleagues published a paper in the journal Neurology, which examined links between childhood mental ability and late-onset dementia. The study showed that mental ability scores were significantly lower in children who eventually developed late-onset dementia when compared with other children tested.
The longstanding belief that breast feeding correlates with an increase in the IQ of offspring has been challenged in a 2006 paper published in the British Medical Journal. The study used data from 5,475 children, the offspring of 3,161 mothers, in a longitudinal survey. The results indicated that mother's IQ, not breast feeding, explained the differences in the IQ scores of offspring. The results of this study indicated that prior studies had not allowed for the mother's IQ. Since mother's IQ was predictive of whether a child was breast fed, the study concluded that "breast feeding [itself] has little or no effect on intelligence in children." Instead, it was the mother's IQ that had a significant correlation with the IQ of her offspring, whether the offspring was breast fed or was not breast fed.
7.4- Wealth and IQ
A book IQ and the Wealth of Nations, claims to show that the wealth of a nation can in large part be explained by the average IQ score. This claim has been both disputed and supported in peer-reviewed papers. The data used has also been questioned.
In addition, IQ and its correlates to health, violent crime, gross state product, and government effectiveness are the subject of a 2006 paper in the publication Intelligence. The paper breaks down IQ averages by U.S. states using the federal government's National Assessment of Educational Progress math and reading test scores as a source.
8- Practical validity
Evidence for the practical validity of IQ comes from examining the correlation between IQ scores and life outcomes.
| Factors | Correlation |
|---|---|
| School grades and IQ | 0.5 |
| Total years of education and IQ | 0.55 |
| IQ and parental socioeconomic status | 0.33 |
| Job performance and IQ | 0.54 |
| Negative social outcomes and IQ | −0.2 |
| IQs of identical twins | 0.86 |
| IQs of husband and wife | 0.4 |
| Heights of parent and child | 0.47 |
| IQ | <75 | 75–90 | 90–110 | 110–125 | >125 |
|---|---|---|---|---|---|
| U.S. population distribution | 5 | 20 | 50 | 20 | 5 |
| Married by age 30 | 72 | 81 | 81 | 72 | 67 |
| Out of labor force more than 1 month out of year (men) | 22 | 19 | 15 | 14 | 10 |
| Unemployed more than 1 month out of year (men) | 12 | 10 | 7 | 7 | 2 |
| Divorced in 5 years | 21 | 22 | 23 | 15 | 9 |
| % of children w/ IQ in bottom decile (mothers) | 39 | 17 | 6 | 7 | < 1 |
| Had an illegitimate baby (mothers) | 32 | 17 | 8 | 4 | 2 |
| Lives in poverty | 30 | 16 | 6 | 3 | 2 |
| Ever incarcerated (men) | 7 | 7 | 3 | 1 | < 1 |
| Chronic welfare recipient (mothers) | 31 | 17 | 8 | 2 | < 1 |
| High school dropout | 55 | 35 | 6 | 0.4 | < 0.4 |
| Values are the percentage of each IQ sub-population, among non-Hispanic whites only, fitting each descriptor. Compiled by Gottfredson (1997) from a U.S. study by Herrnstein & Murray (1994) pp. 171, 158, 163, 174, 230, 180, 132, 194, 247–248, 194, 146 respectively. | |||||
Research shows that general intelligence plays an important role in many valued life outcomes. In addition to academic success, IQ correlates with job performance (see below), socioeconomic advancement (e.g., level of education, occupation, and income), and "social pathology" (e.g., adult criminality, poverty, unemployment, dependence on welfare, children outside of marriage). Recent work has demonstrated links between general intelligence and health, longevity, and functional literacy. Correlations between g and life outcomes are pervasive, though IQ and happiness do not correlate. IQ and g correlate highly with school performance and job performance, less so with occupational prestige, moderately with income, and to a small degree with law-abidingness.
General intelligence (in the literature typically called "cognitive ability") is the best predictor of job performance by the standard measure, validity. Validity is the correlation between score (in this case cognitive ability, as measured, typically, by a paper-and-pencil test) and outcome (in this case job performance, as measured by a range of factors including supervisor ratings, promotions, training success, and tenure), and ranges between −1.0 (the score is perfectly wrong in predicting outcome) and 1.0 (the score perfectly predicts the outcome). See validity (psychometric). The validity of cognitive ability for job performance tends to increase with job complexity and varies across different studies, ranging from 0.2 for unskilled jobs to 0.8 for the most complex jobs.
A meta-analysis (Hunter and Hunter, 1984) which pooled validity results across many studies encompassing thousands of workers (32,124 for cognitive ability), reports that the validity of cognitive ability for entry-level jobs is 0.54, larger than any other measure including job tryout (0.44), experience (0.18), interview (0.14), age (−0.01), education (0.10), and biographical inventory (0.37).
Because higher test validity allows more accurate prediction of job performance, companies have a strong incentive to use cognitive ability tests to select and promote employees. IQ thus has high practical validity in economic terms. The utility of using one measure over another is proportional to the difference in their validities, all else equal. This is one economic reason why companies use job interviews (validity 0.14) rather than randomly selecting employees (validity 0.0).
However, legal barriers, most prominently the U.S. Civil Rights Act, as interpreted in the 1971 United States Supreme Court decision Griggs v. Duke Power Co., have prevented American employers from using cognitive ability tests as a controlling factor in selecting employees where (1) the use of the test would have a disparate impact on hiring by race and (2) where the test is not shown to be directly relevant to the job or class of jobs at issue. Instead, where there is not direct relevance to the job or class of jobs at issue, tests have only been legally permitted to be used in conjunction with a subjective appraisal process. The U.S. military uses the Armed Forces Qualifying Test (AFQT), as higher scores correlate with significant increases in effectiveness of both individual soldiers and units, and Microsoft is known for using non-illegal tests that correlate with IQ tests as part of the interview process, weighing the results even more than experience in many cases.
Some researchers have echoed the popular claim that "in economic terms it appears that the IQ score measures something with decreasing marginal value. It is important to have enough of it, but having lots and lots does not buy you that much."
However, some studies suggest IQ continues to confer significant benefits even at very high levels. Ability and performance for jobs are linearly related, such that at all IQ levels, an increase in IQ translates into a concomitant increase in performance (Coward and Sackett, 1990). In an analysis of hundreds of siblings, it was found that IQ has a substantial effect on income independently of family background (Murray, 1998).
Other studies question the real-world importance of whatever is measured with IQ tests, especially for differences in accumulated wealth and general economic inequality in a nation. IQ correlates highly with school performance but the correlations decrease the closer one gets to real-world outcomes, like with job performance, and still lower with income. It explains less than one sixth of the income variance. Even for school grades, other factors explain most the variance. One study found that, controlling for IQ across the entire population, 90 to 95 percent of economic inequality would continue to exist.
Another recent study (2002) found that wealth, race, and schooling are important to the inheritance of economic status, but IQ is not a major contributor and the genetic transmission of IQ is even less important. Some argue that IQ scores are used as an excuse for not trying to reduce poverty or otherwise improve living standards for all. Claimed low intelligence has historically been used to justify the feudal system and unequal treatment of women (but note that many studies find identical average IQs among men and women; see sex and intelligence). In contrast, others claim that the refusal of "high-IQ elites" to take IQ seriously as a cause of inequality is itself immoral.
9- Public policy
Because public policy is often intended to influence the same outcomes (for example to improve education, fight poverty and crime, promote fairness in employment, and counter racial discrimination), policy decisions frequently interact with intelligence measures. In some cases, modern public policy references intelligence measures or even aims to alter cognitive development directly.
While broad consensus exists that intelligence measures neither dictate nor preclude any particular social policy, controversy surrounds many other aspects of this interaction. Central issues concern whether intelligence measures should be considered in policy decisions, the role of policy in influencing or accounting for group differences in measured intelligence, and the success of policies in light of individual and group intelligence differences. The importance and sensitivity of the policies at issue have produced an often-emotional ongoing debate spanning scholarly inquiry and the popular media from the national to the local level.
9.1- Use of IQ in the United States legal system
Title VII of the Civil Rights Act generally prohibits employment practices that are unfair or discriminatory. One provision of Title VII, codified at 42 USC 2000e-2(h), specifically provides that it is not an "unlawful employment practice for an employer to give and to act upon the results of any professionally developed ability test provided that such test, its administration or action upon the results is not designed, intended or used to discriminate because of race, color, religion, sex or national origin." This statute was interpreted by the Supreme Court in Griggs v. Duke Power Co., 401 US 424 (1971). In Griggs, the Court ruled that the reliance solely on a general IQ test that was not found to be specifically relevant to the job at issue was a discriminatory practice where it had a "disparate impact" on hiring. The Court gave considerable weight in its ruling to an Equal Employment Opportunity Commission regulation interpreting Section 2002e-2(h)'s reference to a "professionally developed ability test" to mean "a test which fairly measures the knowledge or skills required by the particular job or class of jobs which the applicant seeks, or which fairly affords the employer a chance to measure the applicant's ability to perform a particular job or class of jobs." In other words, the use of any particular test would need to be shown to be relevant to the particular job or class of jobs at issue.
In the educational context, the 9th Circuit Court of Appeals interpreted similar state and federal statutes to require that IQ Tests not be used in a manner that was determinative of tracking students into classes designed for the mentally retarded. Larry P. v. Riles, 793 F.2d 969 (9th Cir. 1984). The court specifically found that the tests involved were designed and standardized based on an all-white population, and had not undergone a legislatively mandated validation process. In addition, the court ruled that predictive validity for a general population is not sufficient, since the rights of an individual student were at issue, and emphasized that had the tests not been treated as controlling but instead used as part of a thorough and individualized assessment by a school psychologist a different result would have been obtained. In September 1982, the judge in the Larry P. case, Federal District Judge Robert F. Peckham, relented in part in response to a lawsuit brought by black parents who wanted their children tested. The parents' attorney, Mark Bredemeier, said his clients viewed the modern special education offered by California schools today as helpful to children with learning disabilities, not a dead-end track, as parents contended in the original 1979 Larry P. case.
The Supreme Court of the United States has utilized IQ test results during the sentencing phase of some criminal proceedings. The Supreme Court case of Atkins v. Virginia, decided June 20, 2002, held that executions of mentally retarded criminals are "cruel and unusual punishments" prohibited by the Eighth Amendment. In Atkins the court stated that
"…[I]t appears that even among those States that regularly execute offenders and that have no prohibition with regard to the mentally retarded, only five have executed offenders possessing a known IQ less than 70 since we decided Penry. The practice, therefore, has become truly unusual, and it is fair to say that a national consensus has developed against it."
In overturning the Virginia Supreme Court's holding, the Atkins opinion stated that petitioner's IQ result of 59 was a factor making the imposition of capital punishment a violation of his eighth amendment rights. In the opinion's notes the court provided some of the facts relied upon when reaching their decision
At the sentencing phase, Dr. Nelson testified: "Atkins' full scale IQ is 59. Compared to the population at large, that means less than one percentile…. Mental retardation is a relatively rare thing. It's about one percent of the population." App. 274. According to Dr. Nelson, Atkins' IQ score "would automatically qualify for Social Security disability income." Id., at 280. Dr. Nelson also indicated that of the over 40 capital defendants that he had evaluated, Atkins was only the second individual who met the criteria for mental retardation. Id., at 310. He testified that, in his opinion, Atkins' limited intellect had been a consistent feature throughout his life, and that his IQ score of 59 is not an "aberration, malingered result, or invalid test score."
![]()
The Social Security Administration also uses IQ results when deciding disability claims. In certain cases, IQ results alone are used (in those cases where the result shows a "full scale IQ of 59 or less") and in other cases IQ results are used along with other factors (for a "full scale IQ of 60 through 70") when deciding whether a claimant qualifies for Social Security Disability benefits.
In addition, because people with IQs below 80 (the 10th percentile, Department of Defense "Category V") are difficult to train, federal law bars their induction into the military. As of 2005, only 4 percent of the recruits were allowed to score as low as in the 16th to 30th percentile, a grouping known as "Category IV" on the U.S. Armed Forces' mental-aptitude exam.
10- Validity and g-loading of specific tests
While IQ is sometimes treated as an end unto itself, scholarly work on IQ focuses to a large extent on IQ's validity, that is, the degree to which IQ predicts outcomes such as job performance, social pathologies, or academic achievement. Different IQ tests differ in their validity for various outcomes.
Tests also differ in their g-loading, which is the degree to which the test score reflects general mental ability rather than a specific skill or "group factor" such as verbal ability, spatial visualization, or mathematical reasoning). g-loading and validity have been observed to be related in the sense that most IQ tests derive their validity mostly or entirely from the degree to which they measure g (Jensen 1998).
11. Controversy
11.1- Social construct
Some maintain that IQ is a social construct invented by the privileged classes, used to maintain their privilege.Others maintain that intelligence, measured by IQ or g, reflects a real ability, is a useful tool in performing life tasks and has a biological reality.
The social-construct and real-ability interpretations for IQ differences can be distinguished because they make opposite predictions about what would happen if people were given equal opportunities. The social explanation predicts that equal treatment will eliminate differences, while the real-ability explanation predicts that equal treatment will accentuate differences. Evidence for both outcomes exists. Achievement gaps persist in socioeconomically advantaged, integrated, liberal, suburban school districts in the United States (see Noguera, 2001). Test-score gaps tend to be larger at higher socioeconomic levels (Gottfredson, 2003). Some studies have reported a narrowing of score gaps over time.
The reduction of intelligence to a single score seems extreme and unrealistic to many people. Opponents argue that it is much more useful to know a person's strengths and weaknesses than to know a person's IQ score. Such opponents often cite the example of two people with the same overall IQ score but very different ability profiles.As measured by IQ tests, most people have highly balanced ability profiles, with differences in subscores being greater among the more intelligent.However, this assumes the ability of IQ tests to comprehensively gauge the wide variety of human intellectual abilities.
There are different types of IQ tests. Certainly the information described on this topic relates to a generic IQ test—against a general population, and therefore the results obtained are consistent across the population. However the results do not tell a full story, and are slanted towards 46,XX, and 46,XY candidates.
Candidates with Klinefelter's Syndrome, have a decreased frontal lobe, so for the most part have a reduced IQ when measured against the normal population (46,XX, and 46,XY candidates), but have an enhanced parietal lobe. If measured against IQ tests that are based on matching (patterns, shapes, colors, mathematical series, puzzles), some klinefelters measure into the genius level.
The creators of IQ testing did not intend for the tests to gauge a person's worth, and in many (or in all) situations, IQ may have little relevance.
11.2- The Mismeasure of Man
Some scientists dispute psychometrics entirely. In The Mismeasure of Man, a controversial book, professor Stephen Jay Gould argued that intelligence tests were based on faulty assumptions and showed their history of being used as the basis for scientific racism. He wrote:
…the abstraction of intelligence as a single entity, its location within the brain, its quantification as one number for each individual, and the use of these numbers to rank people in a single series of worthiness, invariably to find that oppressed and disadvantaged groups—races, classes, or sexes—are innately inferior and deserve their status. (pp. 24–25)
He spent much of the book criticizing the concept of IQ, including a historical discussion of how the IQ tests were created and a technical discussion of why g is simply a mathematical artifact. Later editions of the book included criticism of The Bell Curve, also a controversial book. Despite the many updates Gould made to his book, he did not discuss the modern usage of Magnetic Resonance Imaging (MRI) and other modern brain imaging techniques used in psychometrics.
Arthur Jensen, Professor of Educational Psychology, University of California, Berkeley, responded to Gould's criticisms in a paper titled The Debunking of Scientific Fossils and Straw Persons.
11.3- The view of the American Psychological Association
In response to the controversy surrounding The Bell Curve, the American Psychological Association's Board of Scientific Affairs established a task force to write a consensus statement on the state of intelligence research which could be used by all sides as a basis for discussion. The full text of the report is available at a third-party website.
The findings of the task force state that IQ scores do have high predictive validity for individual differences in school achievement. They confirm the predictive validity of IQ for adult occupational status, even when variables such as education and family background have been statistically controlled. They agree that individual (but specifically not population) differences in intelligence are substantially influenced by genetics.
They state there is little evidence to show that childhood diet influences intelligence except in cases of severe malnutrition. They agree that there are no significant differences between the average IQ scores of males and females. The task force agrees that large differences do exist between the average IQ scores of blacks and whites, and that these differences cannot be attributed to biases in test construction. While they admit there is no empirical evidence supporting it, the APA task force suggests that explanations based on social status and cultural differences may be possible. Regarding genetic causes, they noted that there is not much direct evidence on this point, but what little there is fails to support the genetic hypothesis.
The APA journal that published the statement, American Psychologist, subsequently published eleven critical responses in January 1997, most arguing that the report failed to examine adequately the evidence for partly-genetic explanations.
The report was published in 1995 and thus does not include a decade of recent research.
11.4- IQ test
The controversy over IQ tests (also called cognitive ability tests, what they measure, and what this means for society has not abated since their initial development by Alfred Binet.
IQ tests rely largely upon Symbolic Logic as a means to scoring, and as Symbolic Logic is not inherently synonymous with intelligence, the question remains as to exactly what is being measured via such tests. For instance, it is feasible that someone could possess a prodigious wealth of emotional intelligence while being simultaneously unable to comprehend the significance of sequentially arranged shapes. Additionally, someone who cannot read would be at a significant disadvantage on an IQ test , though illiteracy is not indicative of being unintelligent. Measurements of other forms of "intelligence" have been proposed to augment the current IQ Testing Methodology, though such alternative measurements may also be a subject of debate.
Some key issues in the debate include defining intelligence itself (see general intelligence factor) and the political ramification of findings.
Some proponents of IQ testing argue that lower scores by certain groups justify cutting back on welfare and programs like Head Start and New Deal. Many proponents believe different IQ scores demonstrate that power and wealth will always be distributed unequally. Critics claim that IQ tests do not measure intelligence, but rather a specific skill set valued by those who create IQ tests.
Various statistical studies have reported that income level, education level, nutrition level, race, and sex all correlate with IQ scores, but what this means is debated.
Some researchers have concluded from twin studies and adoption studies that IQ has high heritability, and this is often interpreted by the general public as meaning that there is an immutable genetic factor affecting or determining intelligence. This hereditarian interpretation fuels much of the controversy over books such as The Bell Curve, which claimed that various racial groups have lower or higher group intelligence than other racial and ethnic groups (East Asians and Ashkenazi Jews, according to The Bell Curve, are slightly more intelligent on the average than generic whites, whereas blacks on the average have slightly lower IQs) and suggested changing public policy as a result of these findings.
The degree to which nature versus nurture influences the development of human traits (especially intelligence) is one of the most intractable scholarly controversies of modern times.

12- References
Carroll, J.B. (1993). Human cognitive abilities: A survey of factor-analytical studies. New York: Cambridge University Press.
Test de inteligencia Oficial:
+ 50 preguntas
+ Duración 45 min.
+ Resultados fiables
+ Tarifa: 3,00 EUR >>acceder
Mini test para practicar:
+ Gratuito
+ 10 preguntas
+ Duración 7 min. >>acceder


Promoción

